Abstract
Given the wide variation in wave velocities collected through PIT integrity tests, we sought to clarify a previously only intuitive question: are there significant differences in wave propagation in reinforced and unreinforced piles? To investigate, we built three piles of equal length: one fully reinforced, another with 60% reinforcement, and a third with only 1.5m dowels.
Furthermore, our objective was to establish a reference table associating the strength measured by concrete specimen rupture with the velocities recorded by PIT immediately after the tests.
Introduction
With the aim of contributing to the knowledge of our geotechnical colleagues, we dedicated significant resources, including time and effort, to improve our understanding of low-strain integrity testing (PIT).
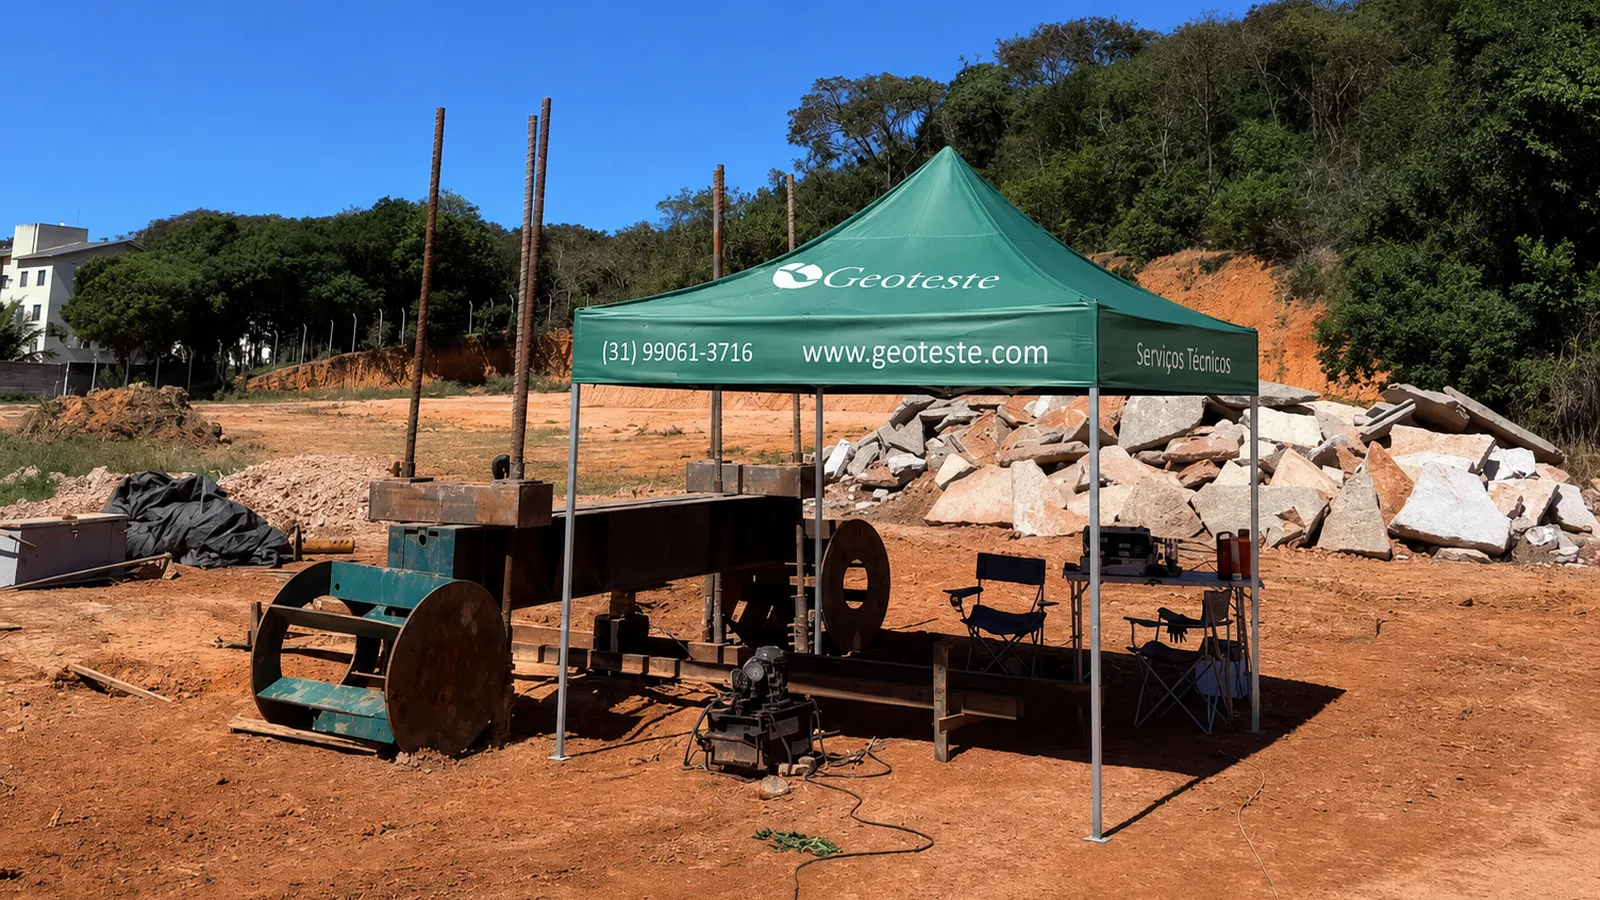
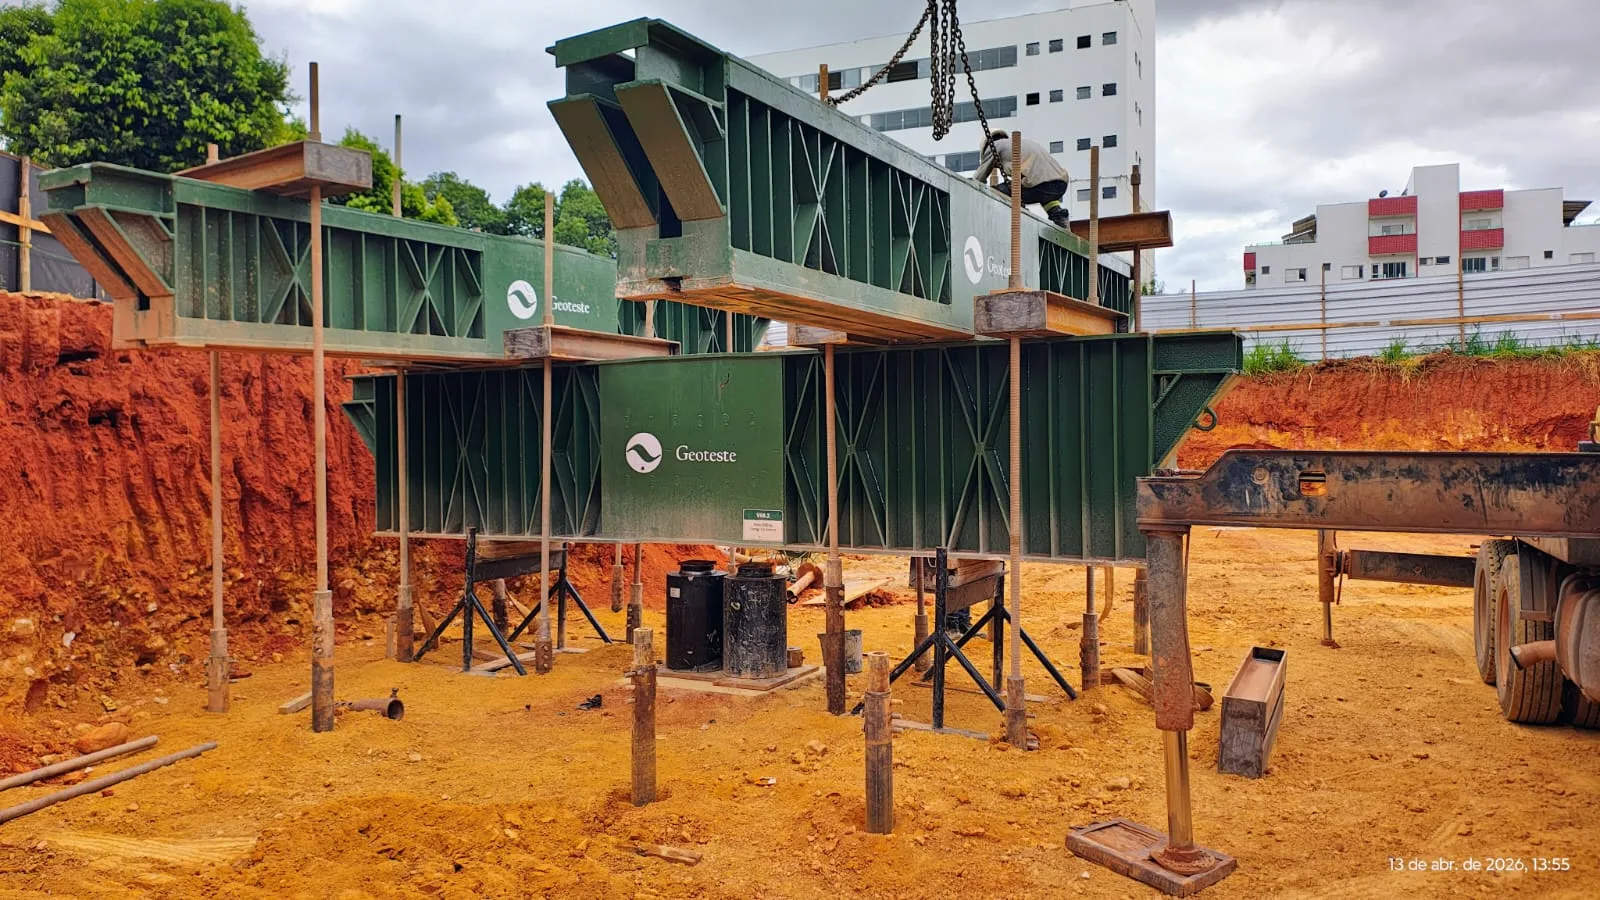
For over three months, we were involved from planning to monitoring, which included establishing a laboratory for crushing 20 concrete test specimens from the piles, preparing a separate site for the tests, acquiring drilling equipment, manufacturing the reinforcement cages, contracting ready-mix concrete, assisting in soil removal and rebar installation, in addition to the time of engineers and technicians for crushing the specimens, collecting and processing signals, among other activities.
Integrity Tests
The low-strain integrity test is a non-destructive procedure whose main objective is to detect relevant impedance changes along the length of foundation piles.
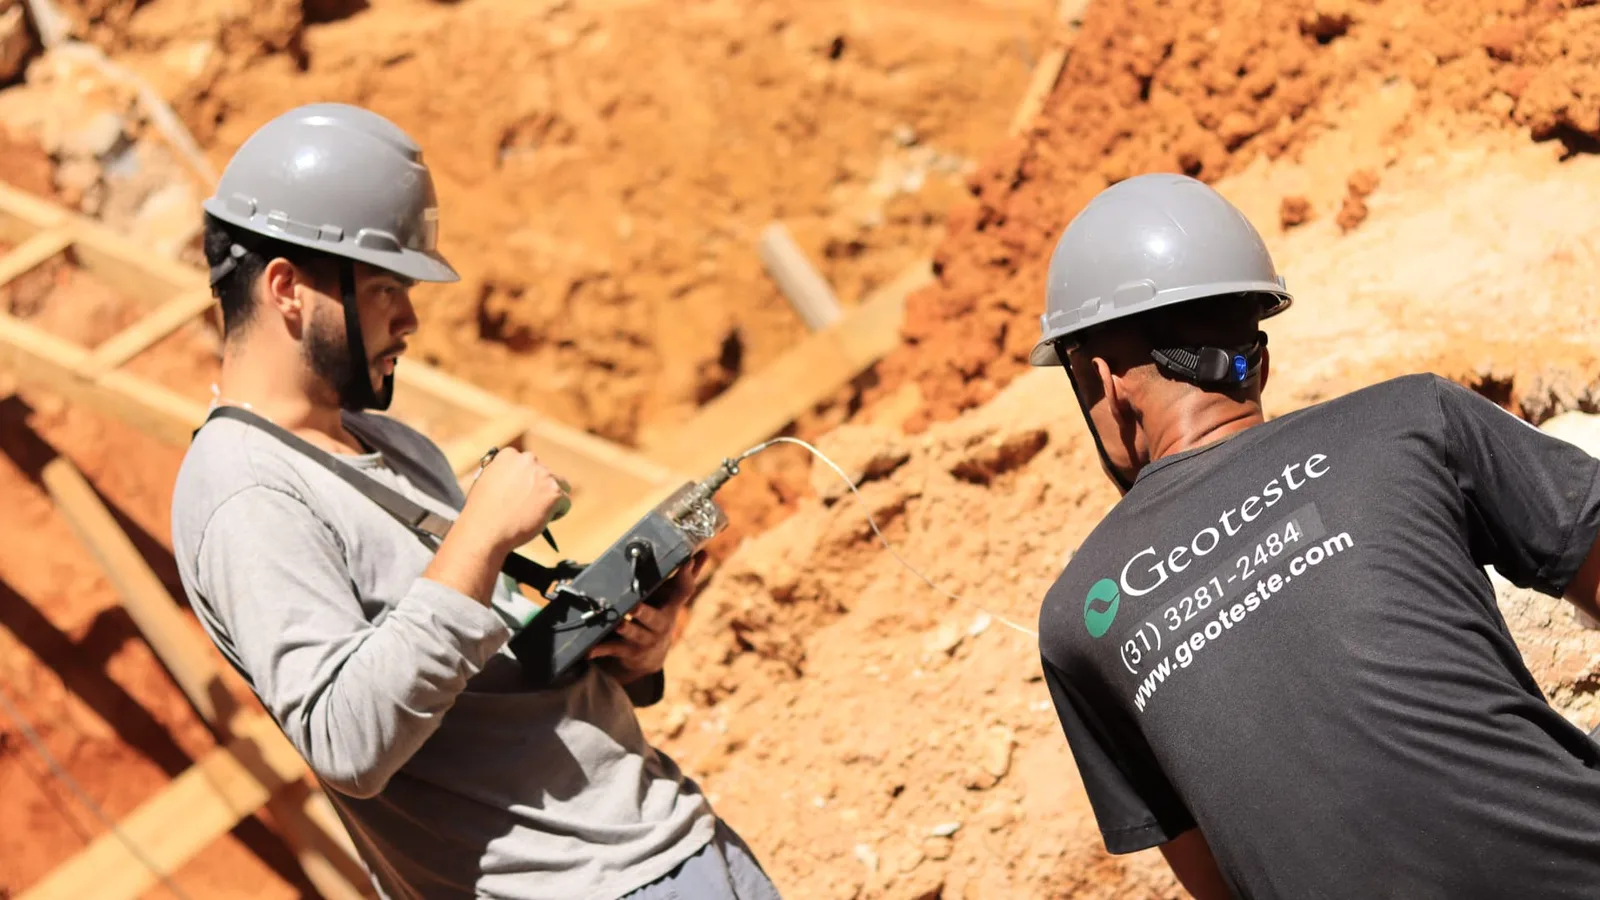
The test is performed with the aid of a high-sensitivity accelerometer installed on the pile head surface. After installing the accelerometer with fixing wax, consecutive blows are applied with an instrumented hand hammer, weighing 1.277 kg.
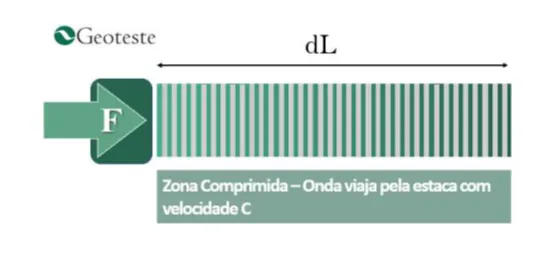
The applied blows generate waves, as shown in Figure 1, which propagate along the entire length (dL) of the test pile.
When these waves encounter any characteristic change along the pile length, reflections occur, which are the focus of study for this test.
Based on the theory of stress wave propagation (Liang and Rausche, 2011), wave reflections, which occur due to changes in characteristics, are analyzed with the aid of sensors. These wave reflections are called impedances.
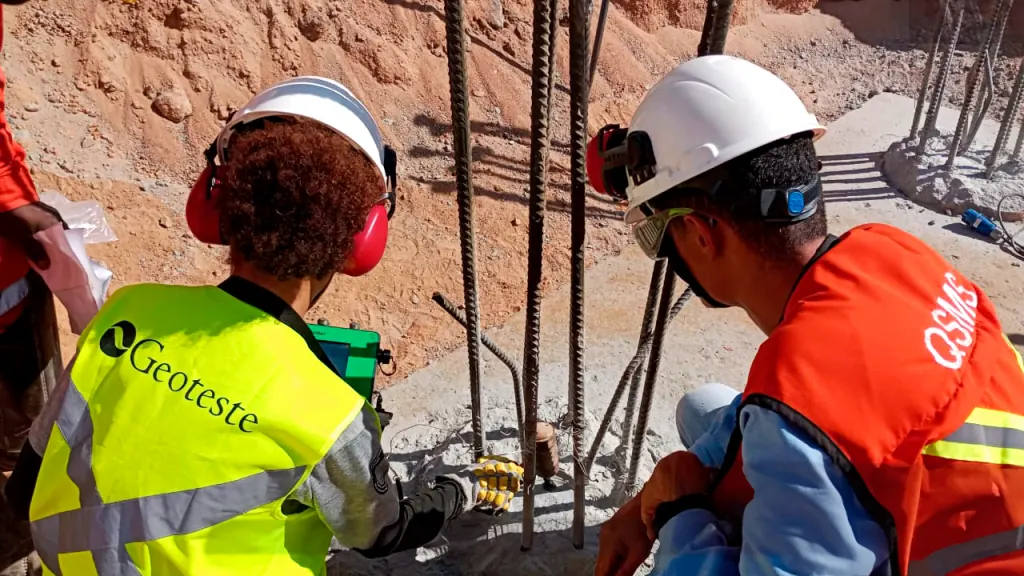
From the applied blows, those considered most representative are selected using the “PIT Collector” equipment from the manufacturer Pile Dynamics Inc., (PDI).
The test is repeated at least three times, moving the accelerometer to different positions. In some cases, the test is repeated several times to eliminate possible random interferences. The signals are transferred to a computer for proper processing and storage.
Technical Standards
There is no document established by consensus and approved by the Brazilian Association of Technical Standards (ABNT) that specifies integrity tests for foundation piles. GEOTESTE uses the “International: Standard Test Method for Low Strain Impact Integrity of Deep Foundations”: (ASTM, D5882 -07). In Brazil, ABNT NBR 6122-10 specifies the need for performing integrity tests for excavated piles with bentonite slurry, on all piles of the construction project.
Integrity Tests
Test Description:
With the aid of a hammer (approximately 1.277 kg) a wave characteristic of the pile material. The propagation velocity (c) is given by:
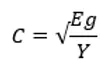
Where:
E=Modulus of elasticity
γ = Density of the pile material
g = Gravity
The velocity for concrete varies, which can occur for several reasons such as: curing and mix variations. Despite these variations, usual wave propagation velocity values for small deformations (as is the case with PIT) are between 3000 m/s and 4000 m/s.
During wave propagation, obstacles will naturally occur. These obstacles cause reflections. These reflections can be caused by variations in material characteristics, presence of lateral friction, toe resistance, significant variations in pile area, or even by the pile toe itself.
These oscillations are called impedance (Z), which is given by the
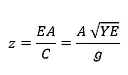
Where:
E=Modulus of elasticity
γ = Density of the pile material
g = Gravity
c = Wave propagation velocity
From the various impedance variations, wave reflections occur. The reflections return to the point where the sensor is installed, causing an abrupt variation in the particle displacement velocity at this point. The increase in impedance is inversely proportional to velocity. The end of the pile represents a large decrease in area, causing a large increase in velocity. The following illustration exemplifies what happens in the case of a pile having a reduction in impedance in the upper half of its shaft. The graph shows the velocity/time relationship for the aforementioned case.
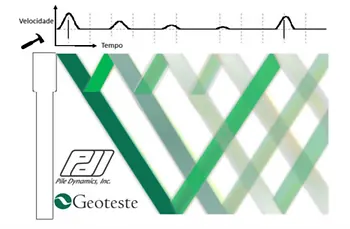
Similarly, there may be a significant enlargement, causing an increase in impedance. In this case, consequently, there would be a decrease in velocity.

Another relevant possibility is a decrease in section followed by an enlargement. In this case, the complexity of the reading is greater, since in addition to the repetition of the first event, the repetition of the second occurs, often making the analysis inconclusive.
By analogy, we can conclude that for the location of neckings, which are generally a cause for concern, one should look for upward-pointing peaks, followed (or not) by downward-pointing peaks. Downward-pointing peaks generally represent enlargements, which are usually not a concern.
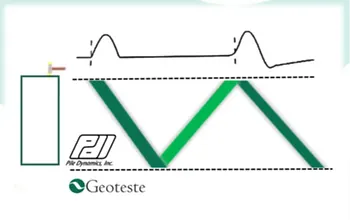
Regarding the pile toe, we primarily have two situations. In the first of these, as represented in Figure 4. The pile shows only significant dissipation of the section until the end of the pile completely.
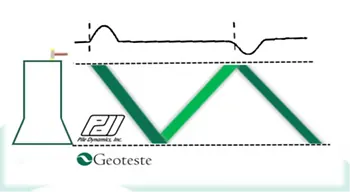
In the second situation represented in Figure 5, the toe reflection shown by the graph occurs on the opposite side, which suggests an enlargement, fixity, or significant toe support.
Procedures
In this experiment, we constructed three excavated piles with a diameter of 40cm and cast with 30Mpa concrete (350kg of cement per cubic meter), the same used in continuous flight auger piles, which is standard in foundation construction.
Each pile was excavated to a depth of 10 meters and had 30cm of polystyrene discs installed at the toe.
Before concreting, one pile, designated TA, received full reinforcement. Another pile, called TB, had 5.7 meters of reinforcement and a jack for performing bidirectional testing. The third pile, designated TNA, had only 1.5m dowels. These dowels were placed to facilitate connection to the cap to be constructed for the static load test.
During the concreting process, 20 concrete samples were collected for performing concrete specimen rupture tests, allowing for monitoring the evolution of the material's strength. These samples, with a diameter of 10cm and a height of 20cm, were stored in a water tank containing water and lime, as recommended by the specific standard.
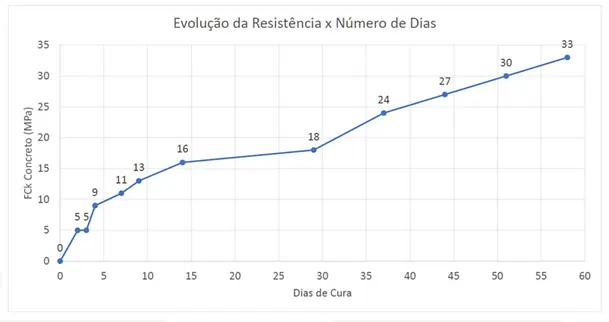
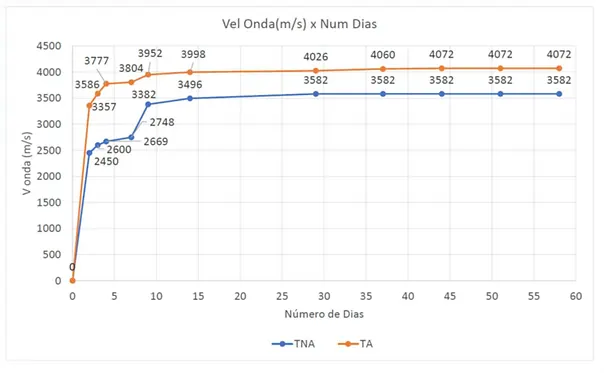
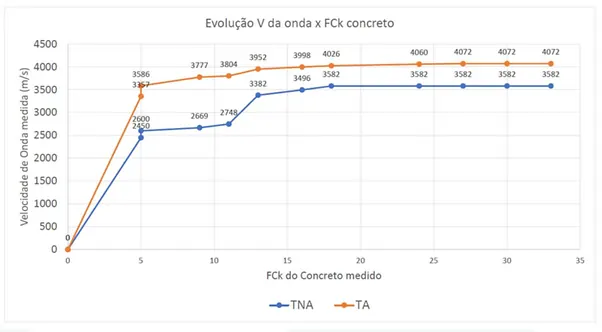
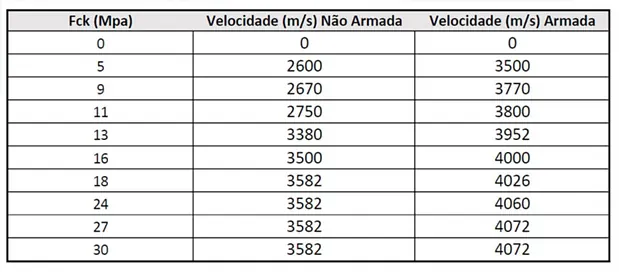
The evolution of strength is presented in the following graphs.
Conclusions
- Reinforced piles exhibit a higher wave velocity.
- The presence of reinforcement at 9.7m or 5.7m does not affect wave velocity.
- The difference in wave velocity is more significant in the initial stages.
- After the 15th day, the increase in wave velocity is minimal.
- Wave velocity stabilizes around 3582m/s for unreinforced piles and shows a slight increase for reinforced piles, reaching 4026m/s and stabilizing at 4072m/s from 27Mpa strength.
- Between 11MPa and 13MPa, there was a significant increase in wave velocity for unreinforced piles (from 2750m/s to 3380m/s).
- The integrity test is effective, and the reference of 4000m/s is valid after two weeks of concrete curing.
References
- ABNT (Brazilian Association of Technical Standards). NBR 6122 (2010): Design and Construction of Foundations. Rio de Janeiro.
- ABNT (Brazilian Association of Technical Standards). NBR 13208 (2007): Piles, Dynamic Load Test. 2nd edition. Rio de Janeiro.
- Engenharia.PDI., PIT Integrity Test, “Pile Dynamics, Inc.” (PDI): Cleveland, Ohio, USA.
- Liang, L., Rausche, F. | October 2011, Quality Assessment Procedure and Classifications of Cast-In-Place Shaft using Low Strain Dynamic Test, Proceedings from Deep Foundations Institute 36th Annual Conference on Deep Foundations: Boston, MA; 553-562.